Cloudiness Across Latitudes
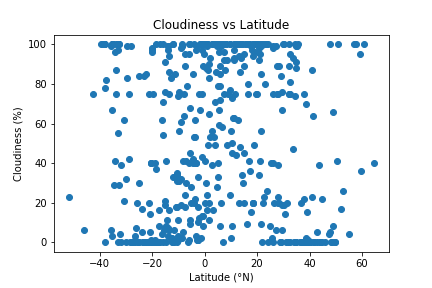
Cloud coverage appears to be randomly distributed across latitude. This could be because cloudiness is affected by many variables and a clear trend does not appear across differing latitudes. One thing to note is that there are clear lines at 0%, ~20%, ~40%, 75% and 100% that appear more frequently than other values nearby. This is most likely because cloudiness is a subjective value assigned by humans and not something directly measured.
Visualizations